
HeroMadness
Web APp + Data Visualization
Tools : Javascript (D3 library) + HTML + Python + MySQL + Microsoft Excel
January 2019 - May 2019
Data-Driven Web Application Course / Team Project
Overview
Tournaments of all our favorite superheroes and villains!
This visualization does the impossible -- or highly improbable. It does what every hardcore comic book/pop culture fanatic wants to see: which characters are the strongest of their respective universe and which characters are the strongest across many different universes. Thus the algorithm compares all traits that can be paralleled between characters to create a single metric from which to see who truly reigns supreme in the fictional world.
Team
Karen Jan , Jean-Charles Turban Davila , Samuel Williams
Role
For this project, I worked on the front-end portion of the visualization which included rendering the brackets. I implemented the text being printed on the boxes using a combination of for loops. I worked on animating the simulation which entailed incorporating the text transitions, and coloring. Finally, I work on styling and adding more details to the animation and transitions.

Design Process

Skip to
Project Context
The superhero visualization
My team and I were tasked with creating a data visualization using a dataset. The parameters for this project necessitated that the visualization be manipulated by users through inputs, selection, and clicks.
We came across the dataset that was used in this visualization on Kaggle, and noticed that it had many parameters and attribute on individual characters existing in various superhero universes. As a result, we decided that these attributes can be used in some way to simulate fighting scenarios between these different characters.
1. Research
Finding datasets for our visualization
In this stage of the project, my team member and I did research on a datasets we could possibly use for our data visualization. From our research we came across two datasets : super_hero_powers.csv and SuperheroDataset.csv
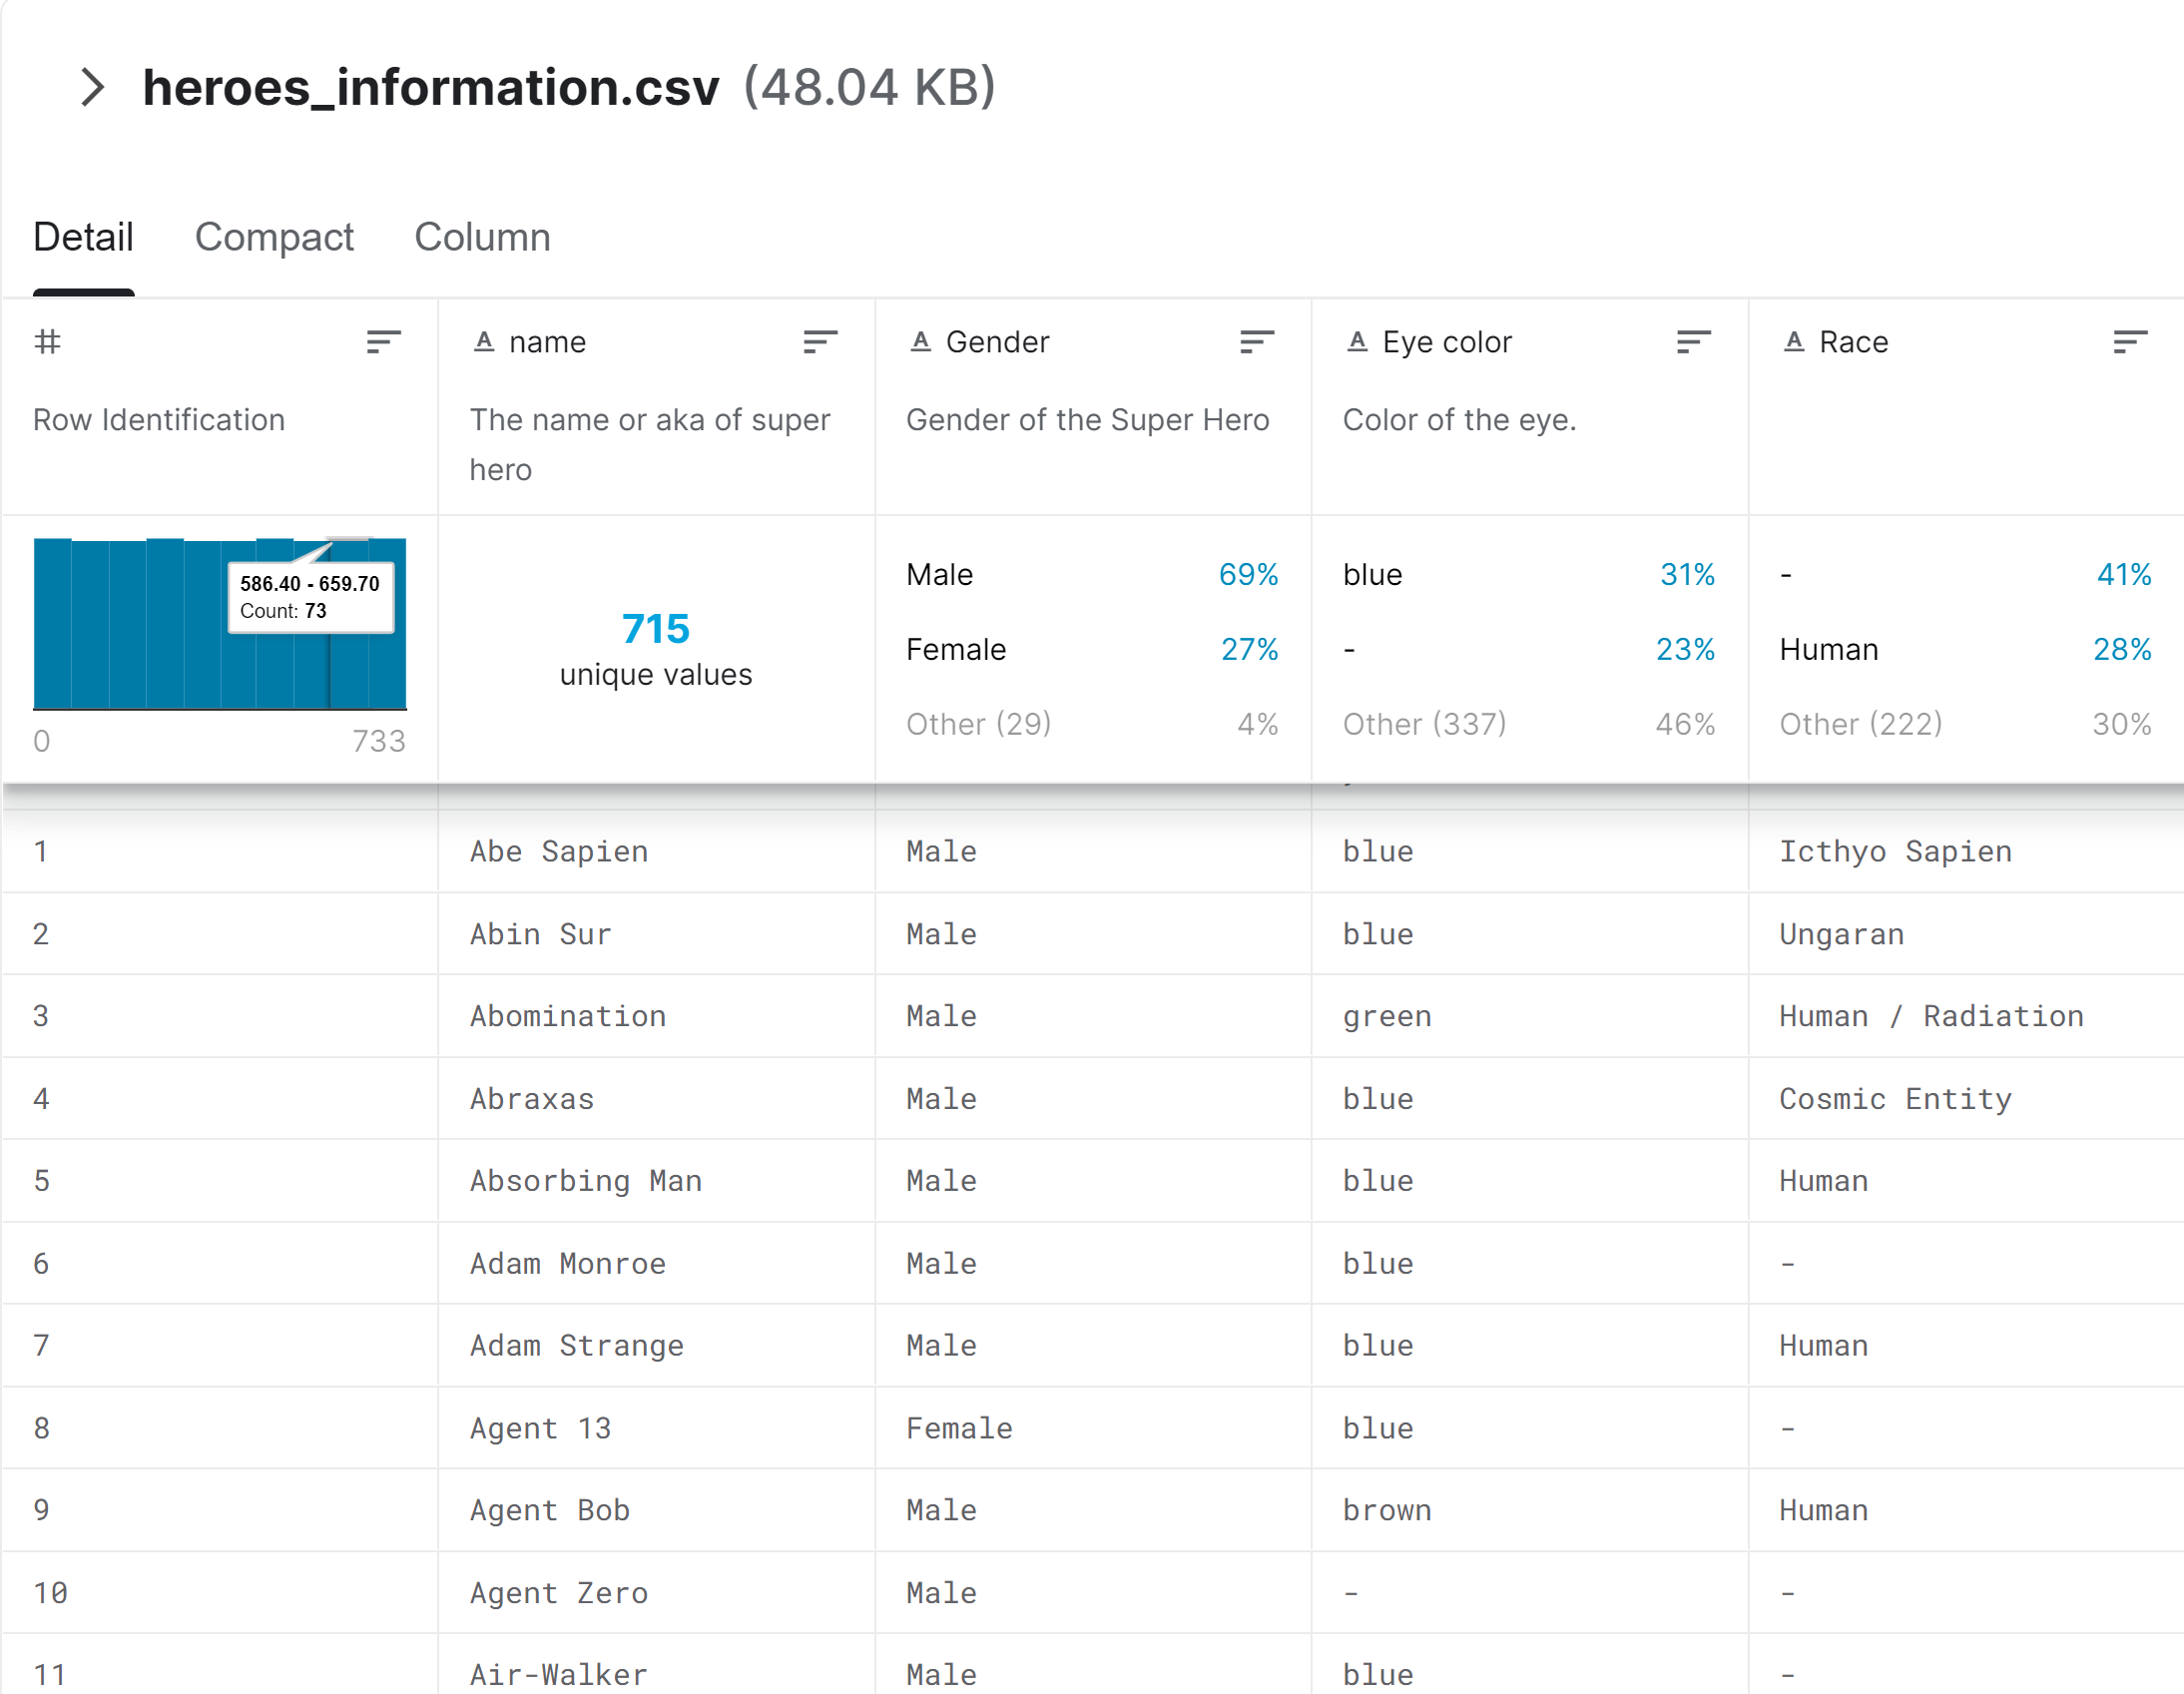
Additional statistics about heroes such as Combat, Power, Strength, Durability, Intelligence, Speed, Height and Weight.
With the exception of height and weight, all the values are between 0-100.

1 column dedicated to the hero’s name
167 columns dedicated to a specific superpower (e.g: intelligence, invisibility, omnipotence). The values of those 166 columns are True/False.
Our dataset, final_dataset.csv, is a combination of both of these datasets. We merged both data sets on the name of the heroes to have more data points for each hero (joined_data.csv).
2. Design & Iterate
Once my team and I found our dataset, we then started to outline the design concept of our visualization.
We came up with the idea of a fight simulator visualization—have a way that a user can generate a battle simulation between fantasy superhero villains and other miscellaneous characters, while giving them multiple options to influence its outcome.

Design Inspiration
The rationale behind our design was inspired heavily from the march madness brackets (basketball games)
Because people naturally argue about which heroes/villains are the strongest/weakest we believed March Madness brackets were the perfect way to represent the simulation.
Elements & Rationale


Users have to click on the right button to display the simulation.
Trade-off - if a user does not interact with the button since this causes the visualization to remain incomplete.
Therefore the button clicking interactivity has to be very obvious


Fighters, though randomly selected, are chosen based on the users defined parameters. These includes whether fighters are from a specific universe, heroes or villains, male or female, etc. The winers from the first round move on the next, then those winners much fight. This happens till a final winner is announced.


3. Development
During this stage of development, my team and I started building the visualization for our project. Using the elements defined in our design concept we built the framework for how the app will look and function.
Interactive Elements and their Design Rationales
Buttons
The fight button on our visualization plays a simulation by randomly generating characters based on the user’s selected parameters, and then following the battle overtime until a winner is defined.
Rationale: We included the fight button instead of having the simulation generate automatically because we wanted the user easily generated multiple scenarios just by clicking a button.
Inputs
The inputs on the page allows the user to input weights to Damage, Health, Defense and Accuracy statistics to see how the different weights affect fights and who wins that battle.
Rationale: We decided to use inputs of type numbers to ensure that users would give meaningful weights (e.g: inputs won’t allow “fire” as a weight).
Checkboxes & dropdown menu:
These dropdown menus and checkboxes are other forms of interactivity that allows the user to apply filters to the generated character.
Rationale: We included the checkboxes so a user can be selective of what traits they would like for the simulation to have.
Rationale: The dropdown menus also help with allowing the user to have more filtering power.

Design Choices
Determining the winner
To display the data, 16th characters are pulled from our dataset in the first round of the simulations:
Those characters are passed into an algorithm that uses their characteristics such as defense and accuracy to determine who would win each round of the simulation.
We designed the algorithm to pre-determine who wins for each round:
This saves time having to calculate per round, helping us to perform the simulation animation/transitions faster.
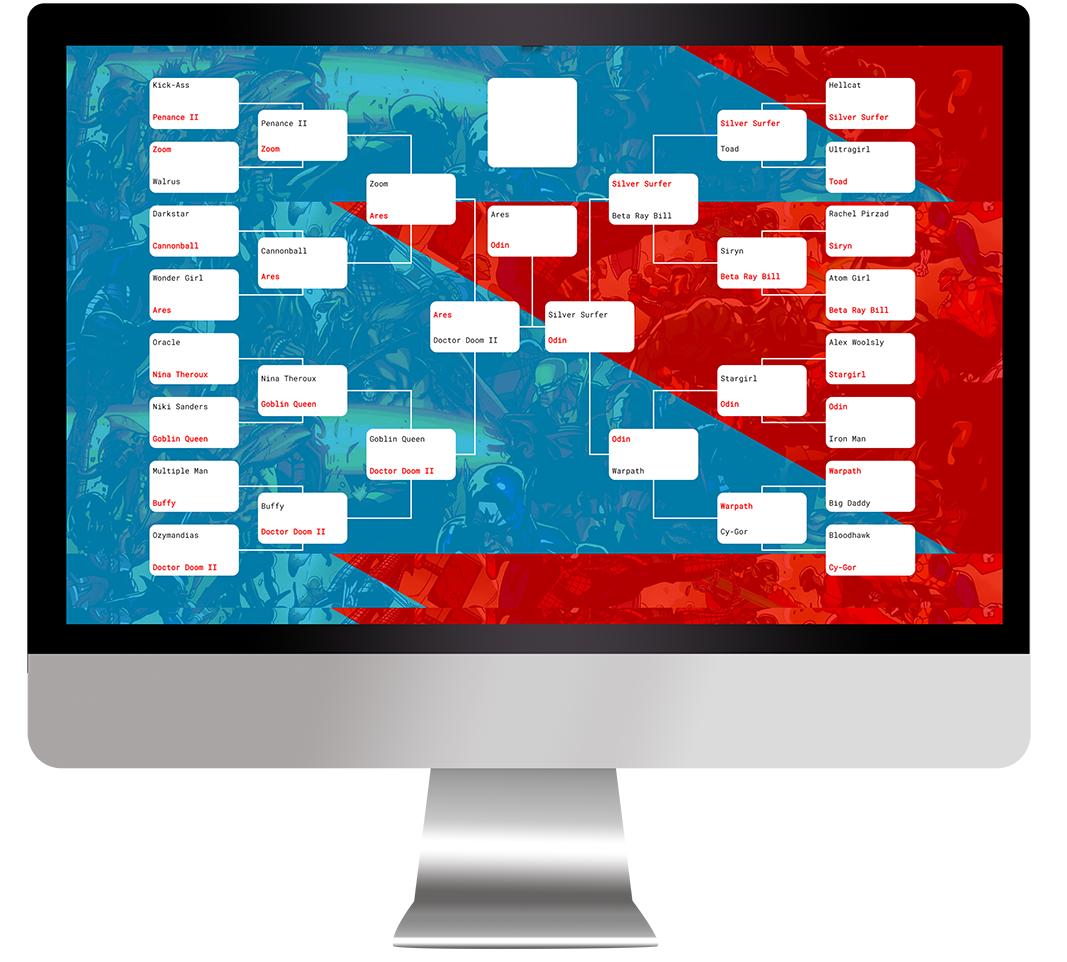
The data of winners for each round is displayed within the brackets of each round using text elements.
Winners of a round would be bolded and red to allow viewers to easily conclude who the winner is and can easily follow the path of winners until the final round.
We displayed the winners and round one by one using transitions and animation instead of rendering the data immediately because we wanted the user to follow and anticipate the outcome of the round.

We chose the background image because it coincided with the competitive theme of our visualization. The overall font and colors were chosen to convey a comic-like feel and lighthearted tone.
4. Final Design
Heromadness Simulation…
Wondered which one your favorite heroes or villains would win in a fight? Our Heromadness simulator does exactly that! Its simulates fight scenarios between heroes and villains cross the superhero universes including Marvel, DC and Darkhorse.
Lets the fight begin
Watch fight scenarios play out between heroes and villains!
Change character values
Define attributes such as attack, health, defense, accuracy or tier to level the plain-field